Custom Reports
2 min
Build, save, and share custom usage dashboards across your teams
The Custom Dashboards feature enables teams to create tailored, real-time views of usage data. It is designed to answer specific questions and support deeper analysis.
These dashboards:
- Stay continuously updated with real-time data
- Can be saved for ongoing use
- Are easily shareable across your organization
Creating a Dashboard
To create a custom dashboard:
- Select a meter you want to analyze
- Apply filters based on:
- Customer
- Custom dimensions
- You can:
- View all values for a selected dimension
- Drill down into a specific key-value pair
- Layer multiple filters for deeper, more granular analysis
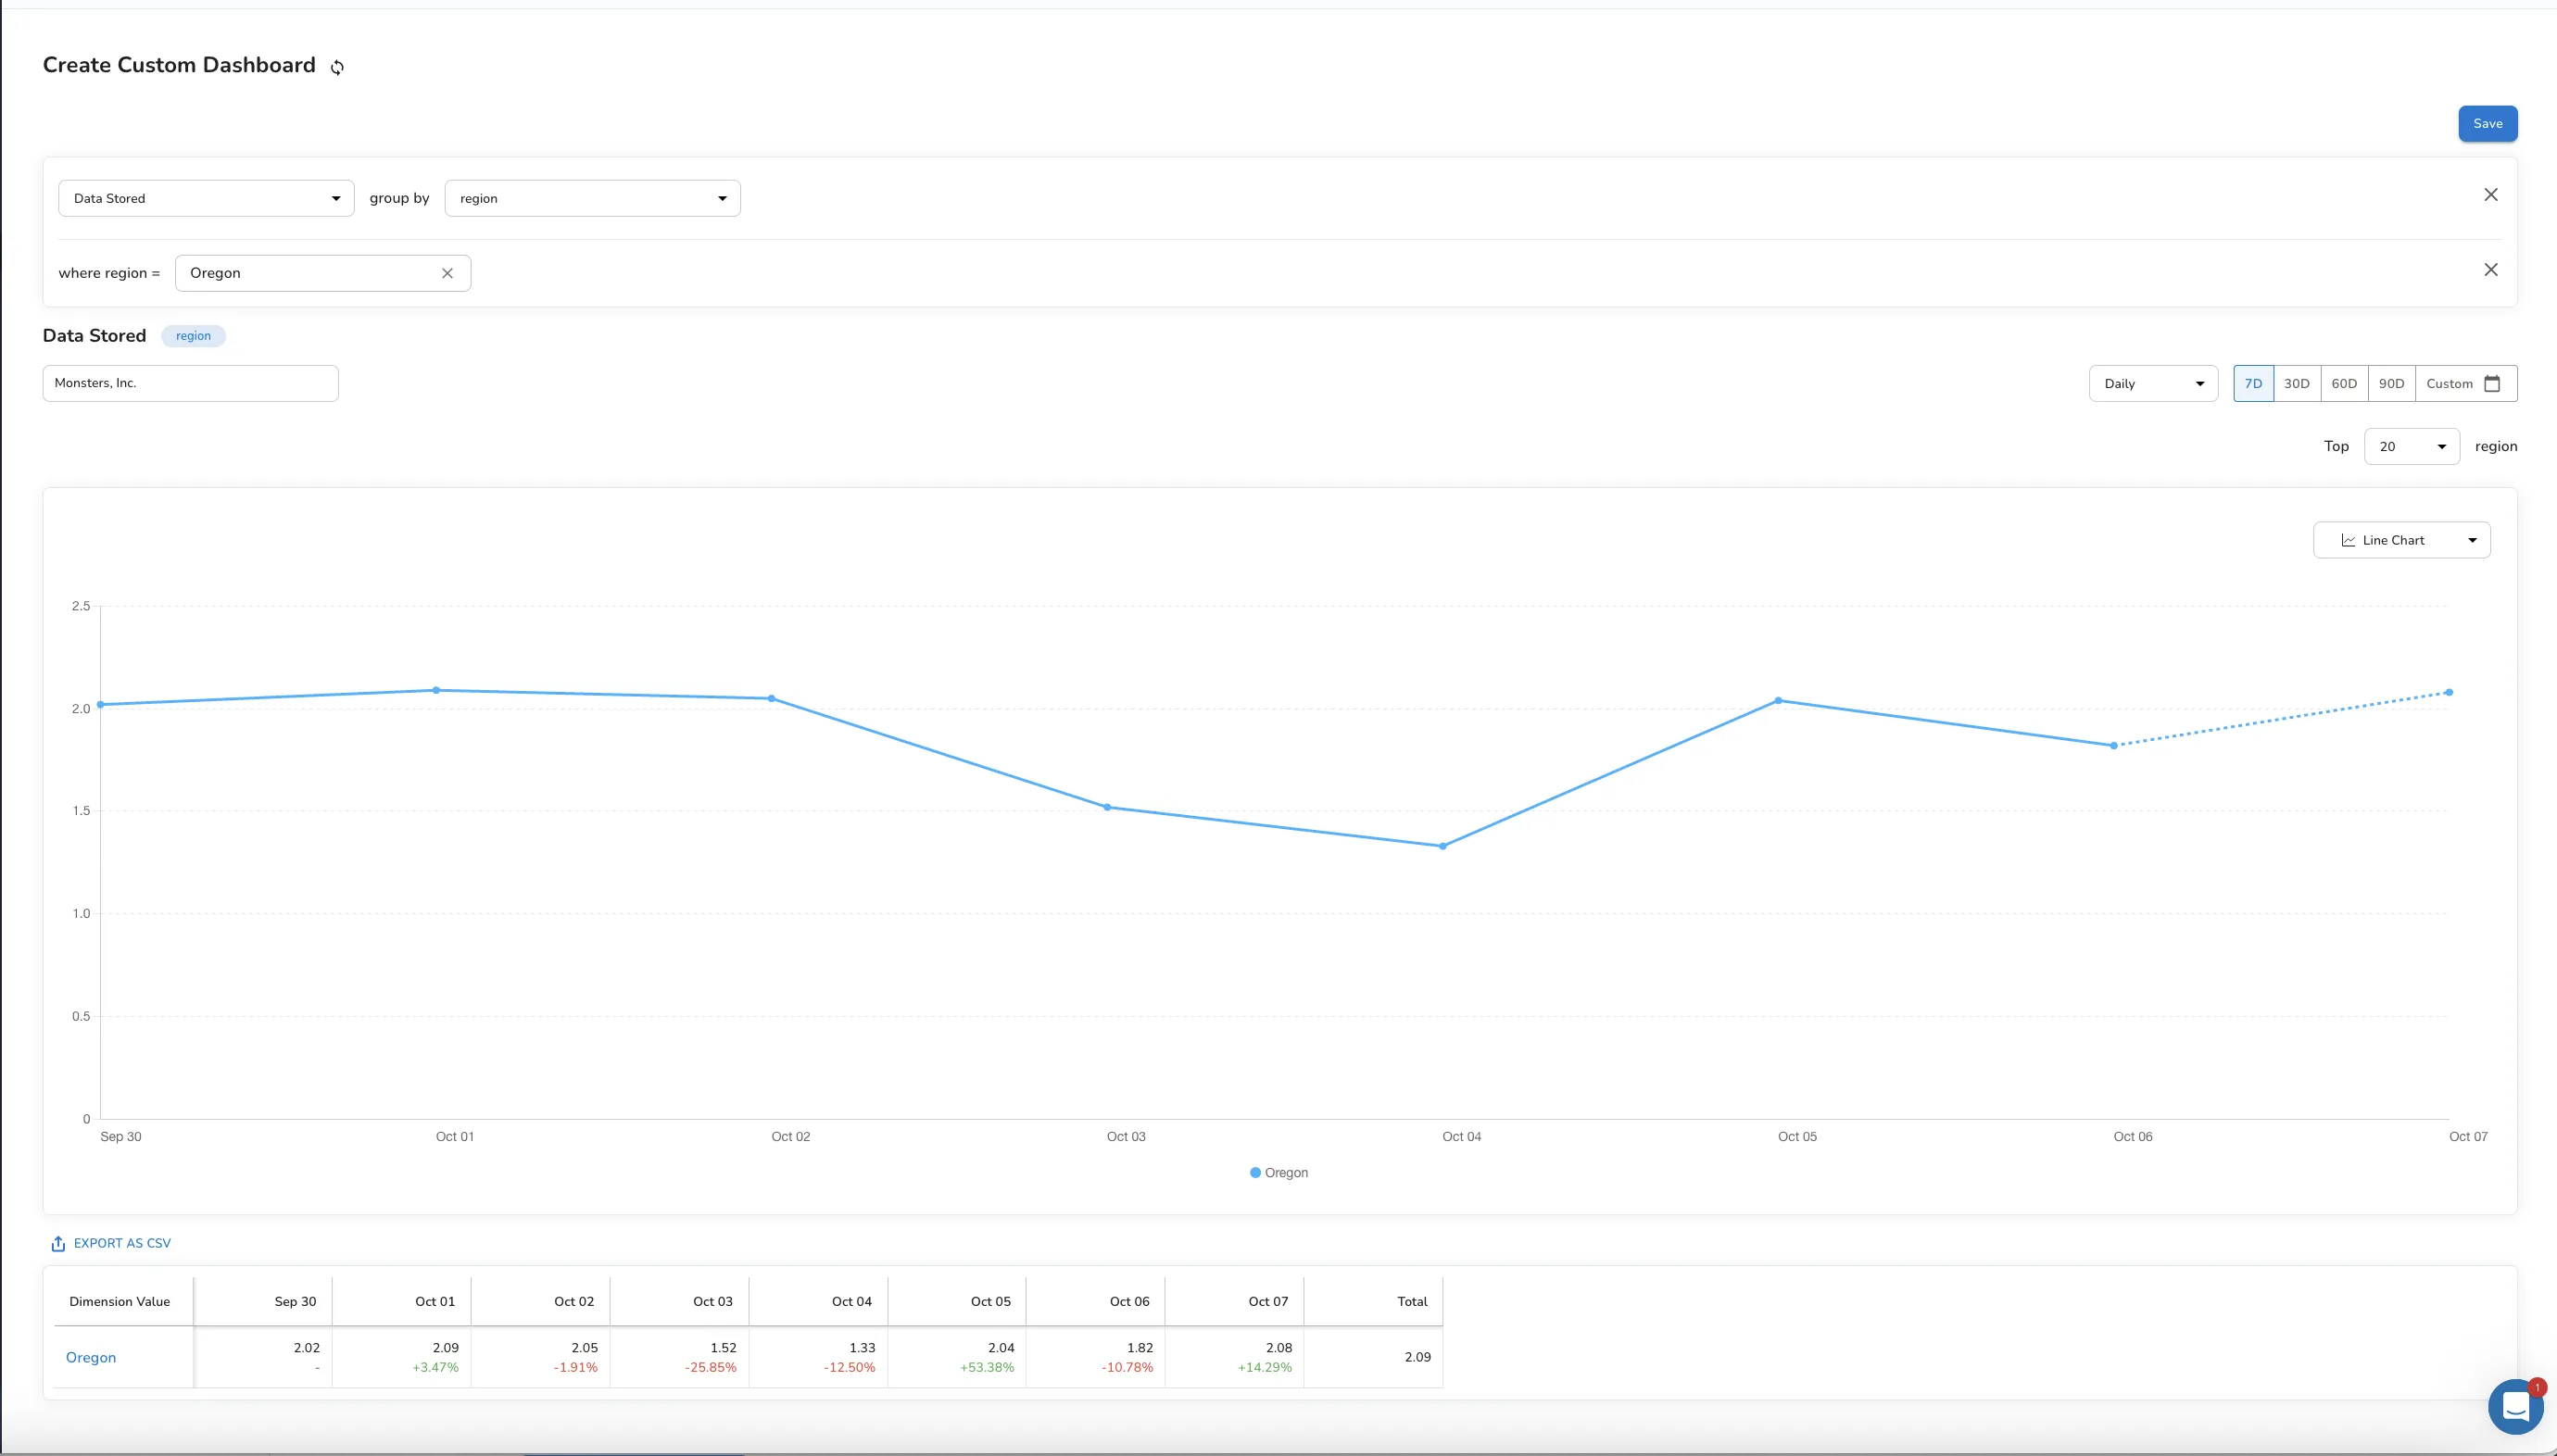
A sample dashboard might answer the question: "How much data was stored by customer Monsters Inc. in the cloud region Oregon from 9/30 through 10/6?" This kind of targeted dashboard helps teams across your organization make informed, data-driven decisions.
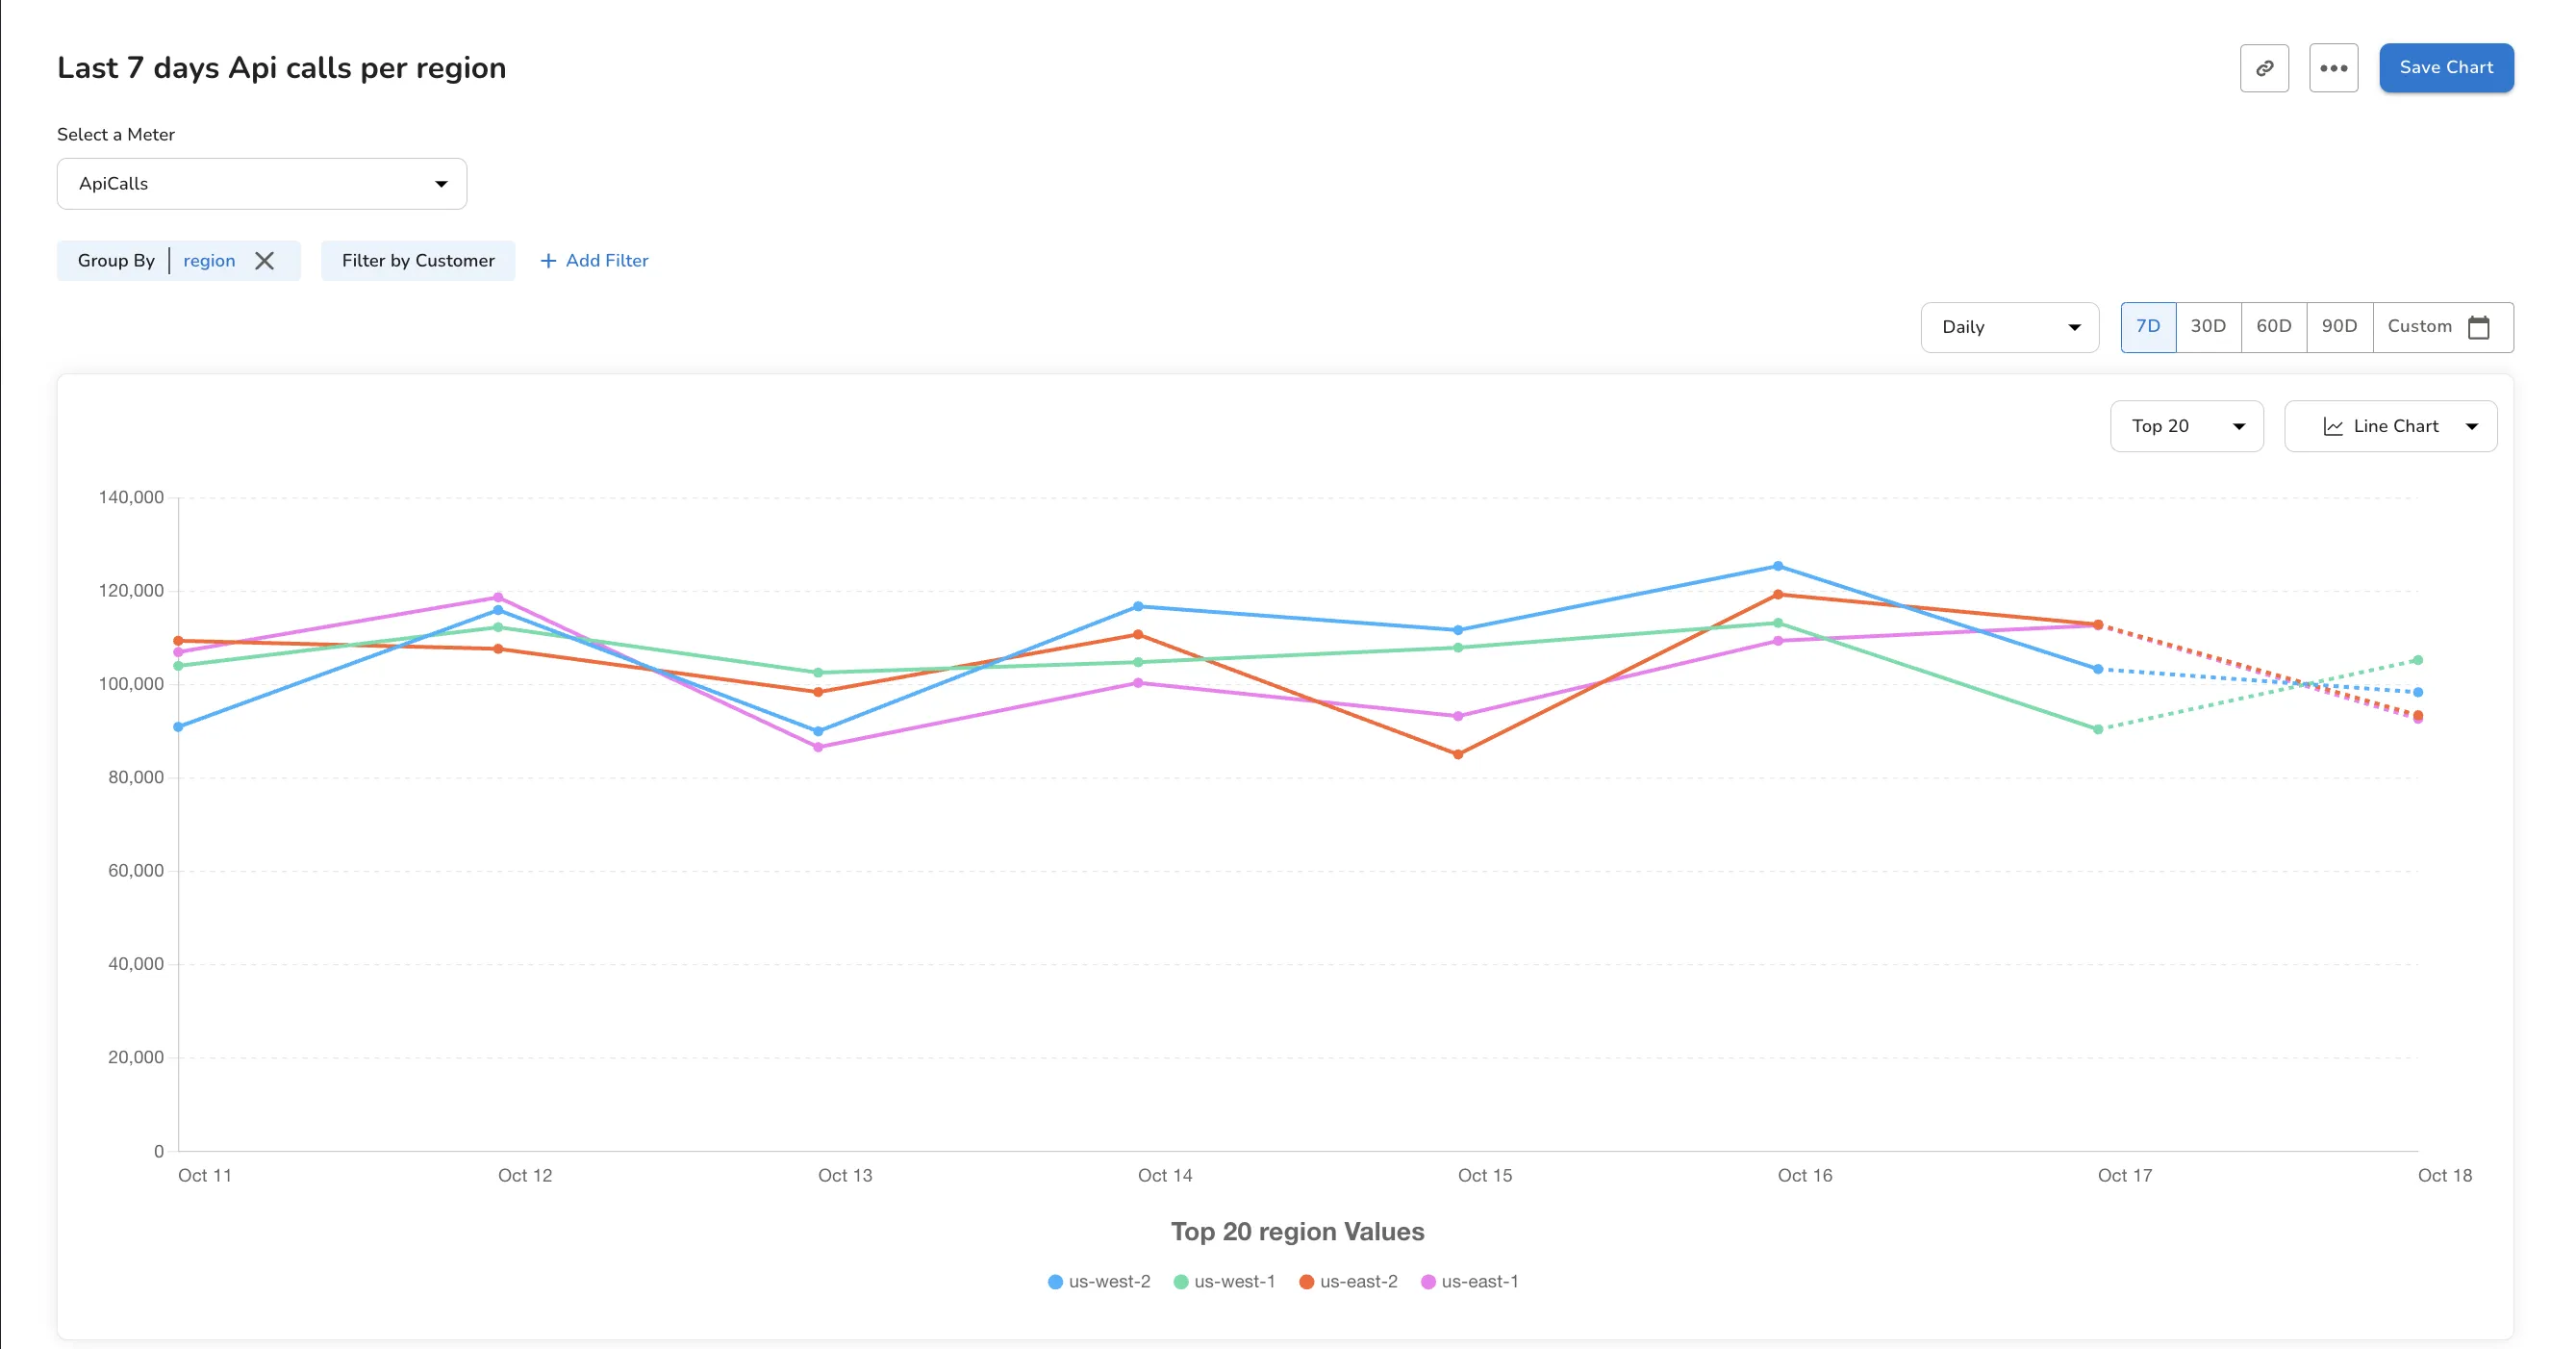
Some other examples of custom dashboards created with the tool are shown below: