Billing Reporting
Real-Time Dashboard for Aggregated Revenue
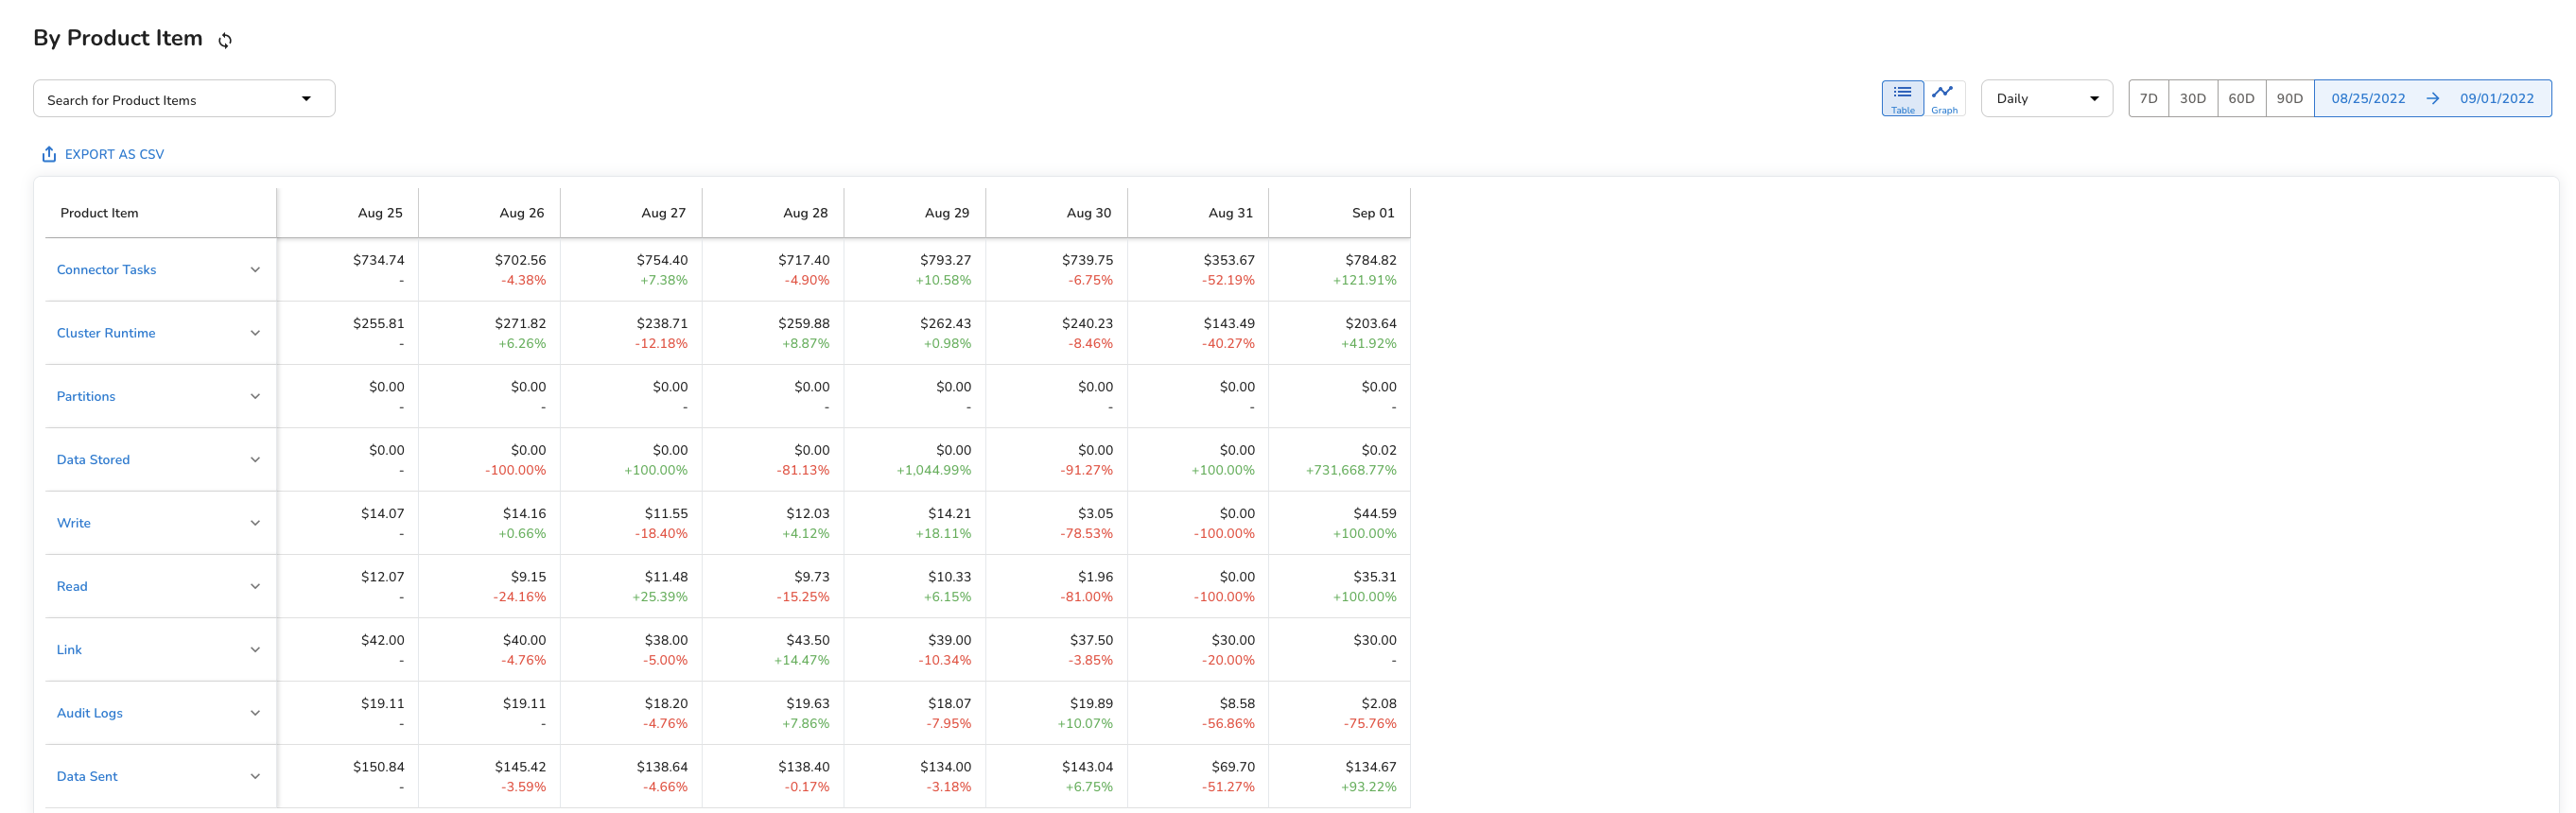
Amberflo’s Billing Analytics tool provides an out-of-the-box, interactive dashboard that displays real-time revenue data. You can view revenue segmented by customer, metered product item, or deployed pricing plan.
This tool delivers actionable insights at a glance, helping you answer critical questions such as:
- Which metered items are being used most?
- How much revenue is each product item generating?
- Which capabilities provide the most value to each customer?
- Which pricing plans are the most profitable?
You can select any time range and aggregation interval to explore trends over time. The dashboard includes percentage changes to help you understand how your revenue is evolving and where growth is coming from.
Billing by Customer
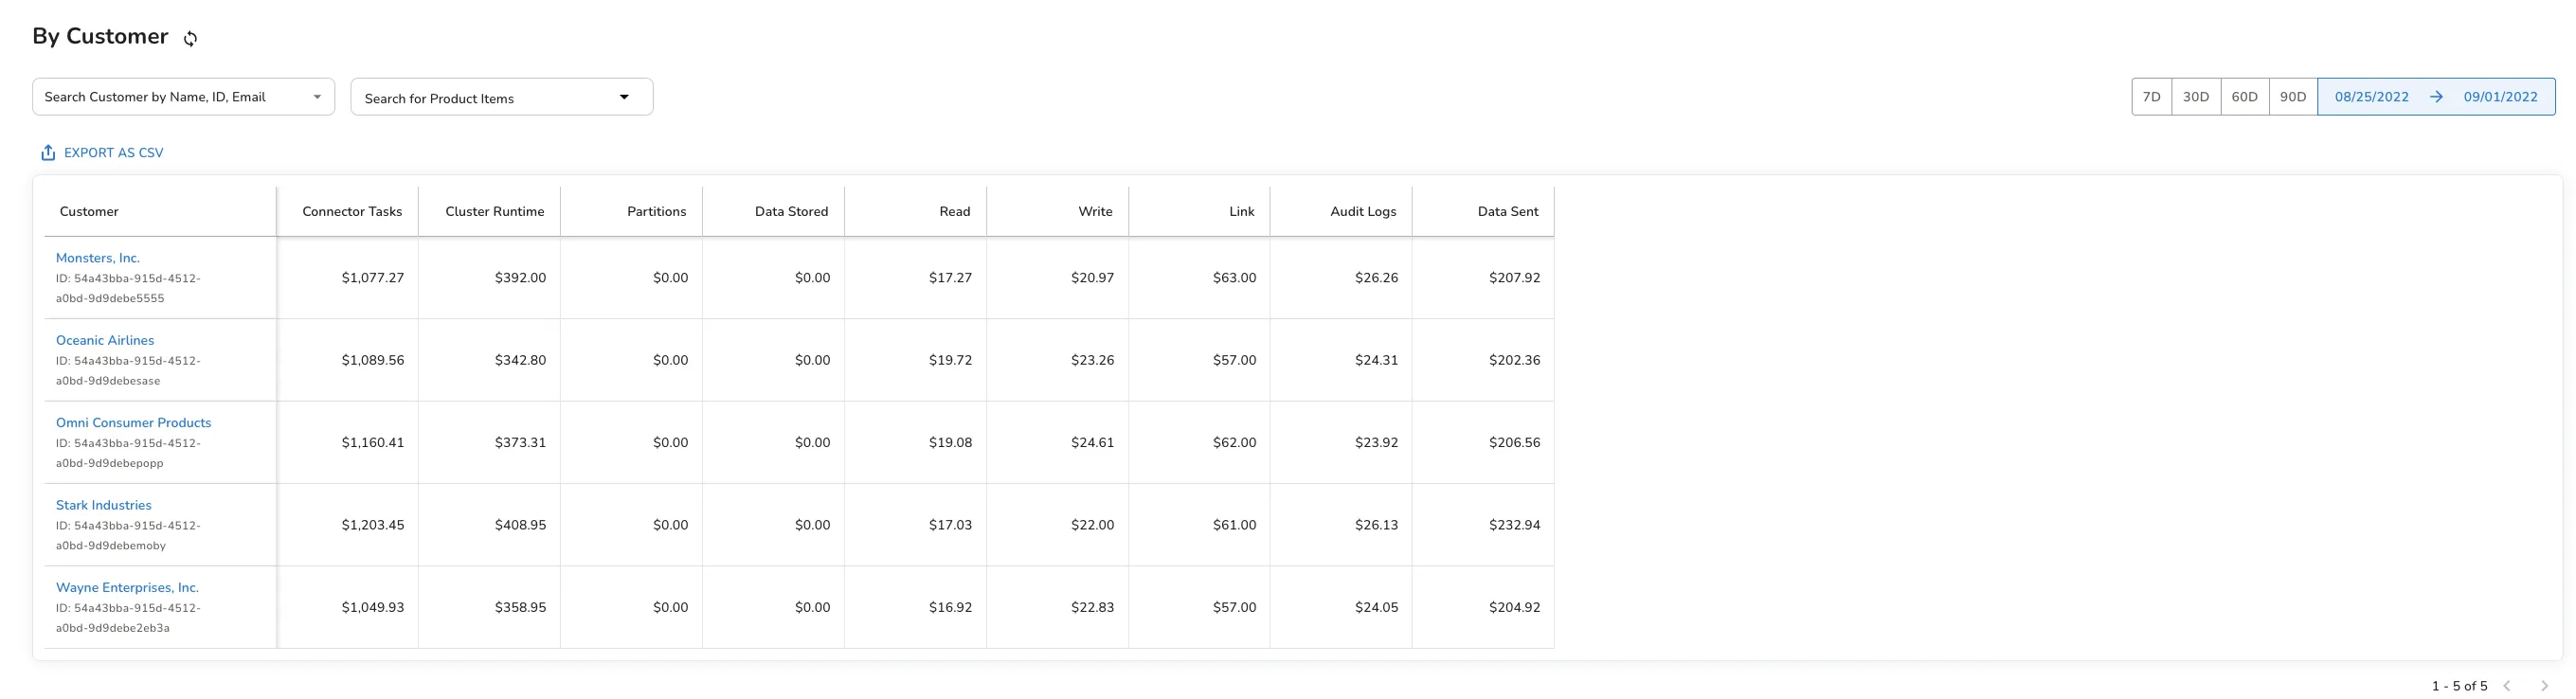
The Customer View shows total revenue by customer, broken down by product item. You can drill down into individual customers and use checkboxes to filter the product items displayed, allowing for a more focused analysis of usage and revenue drivers.
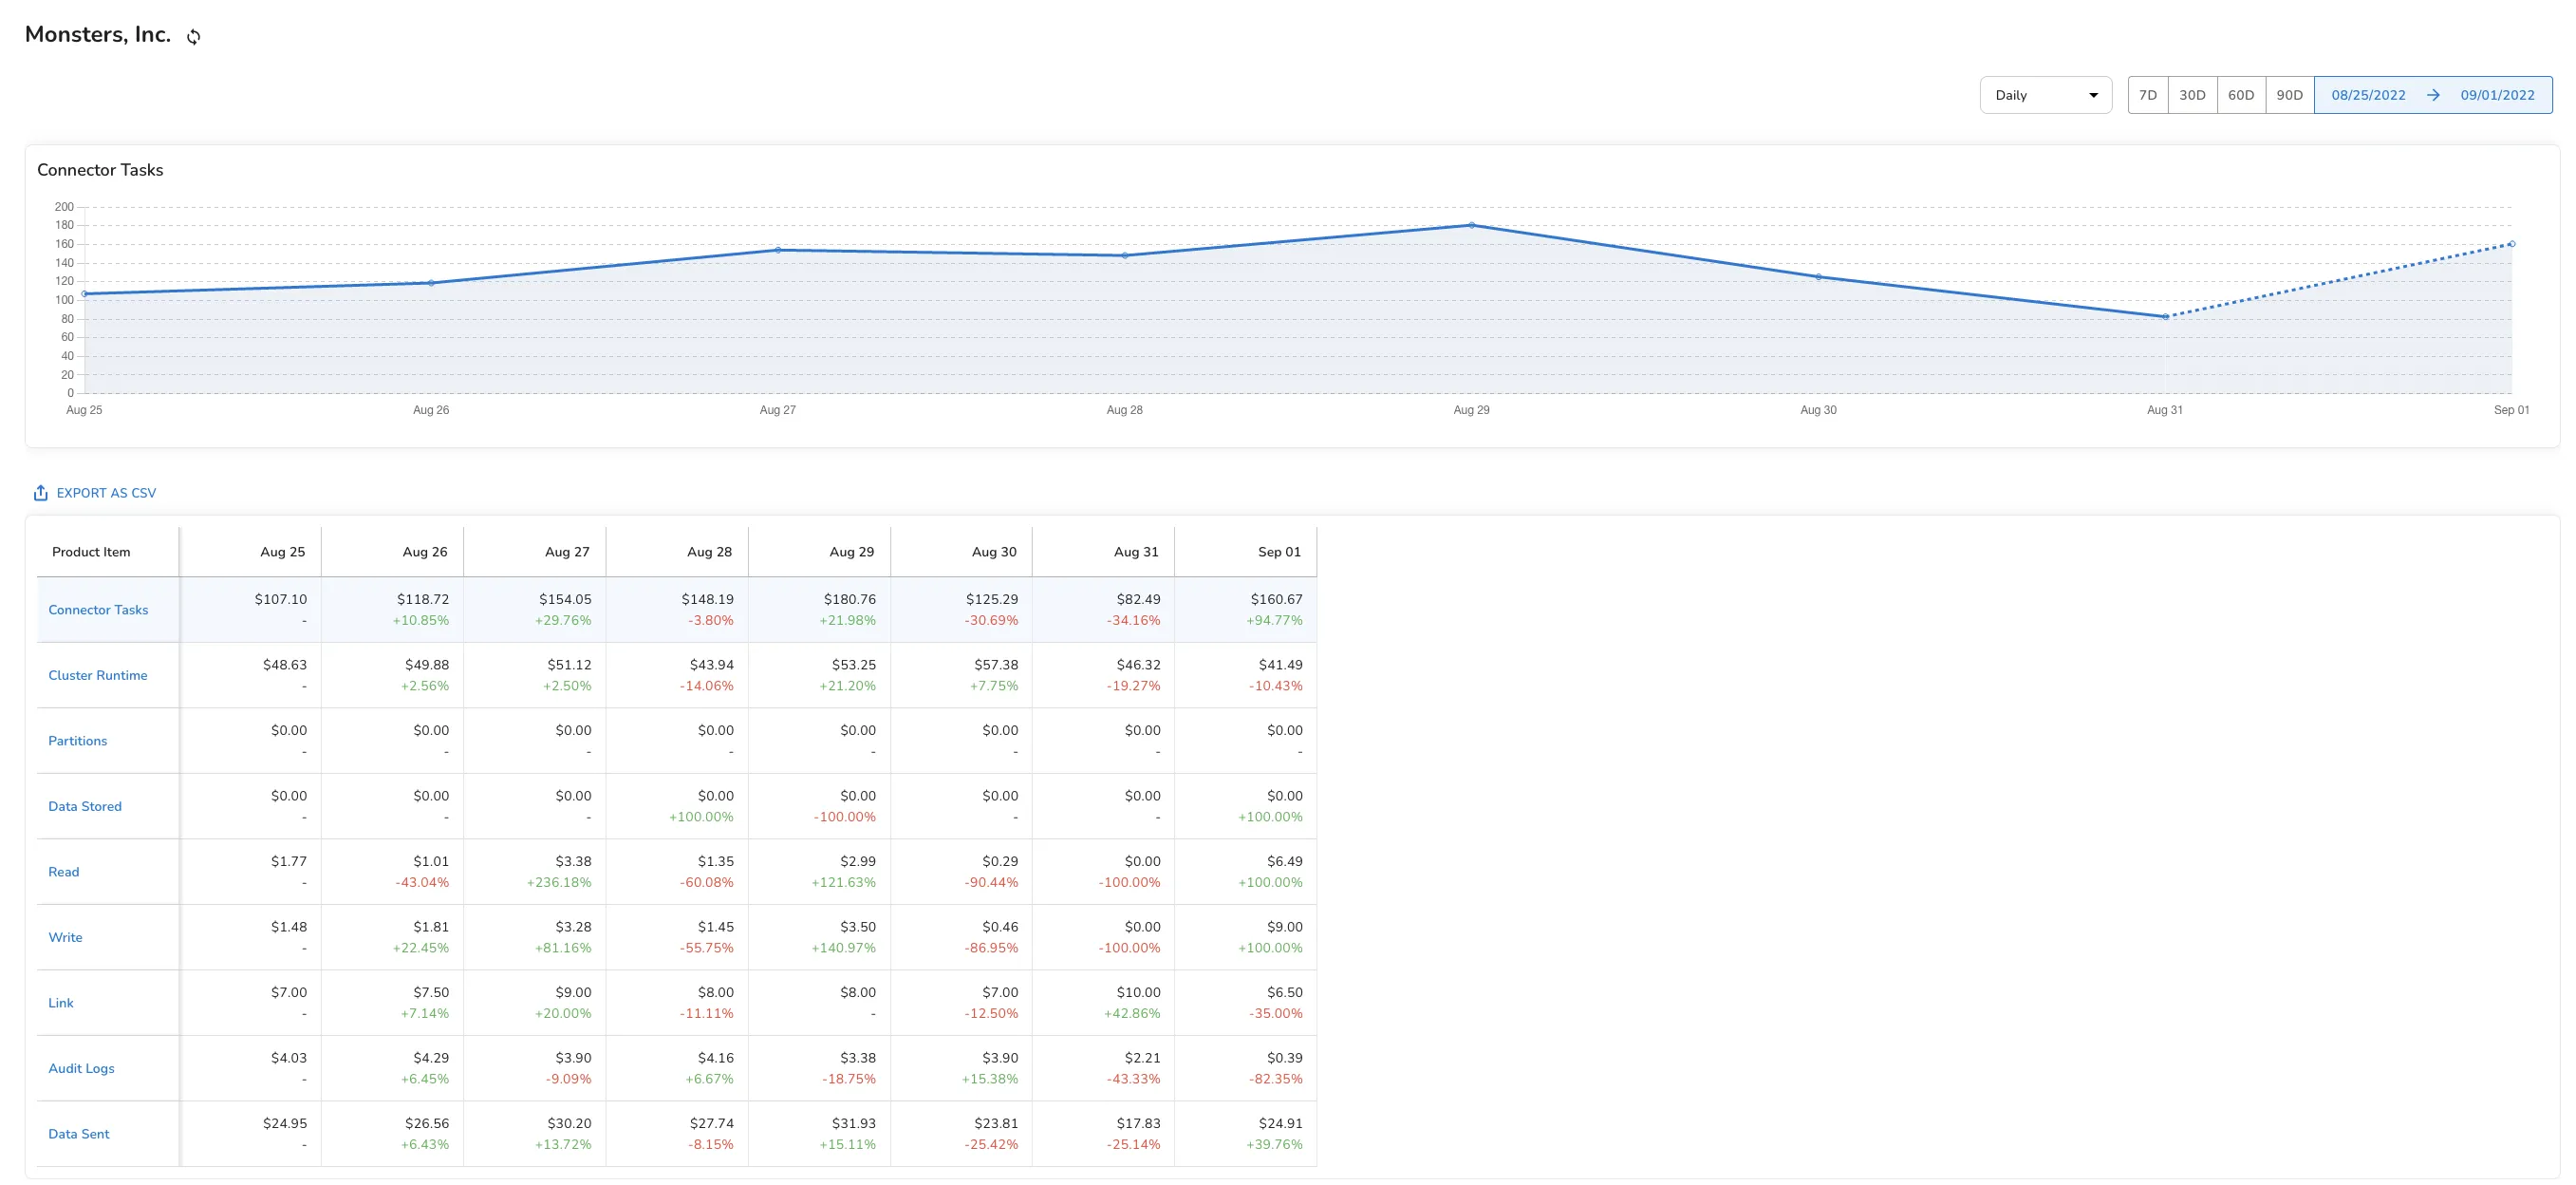
Clicking on a customer lets you drill down into their usage and spending details. The breakdown shows the customer’s spend by product item, with each row in the table representing a single day. For each day, you’ll see the total spend on that item along with the percentage change from the previous day.
You can customize the time range and interval to match your analysis needs.
To view a visual trend of spend over time for a specific product item, simply select the item to display its graph.
Billing by Pricing Plan
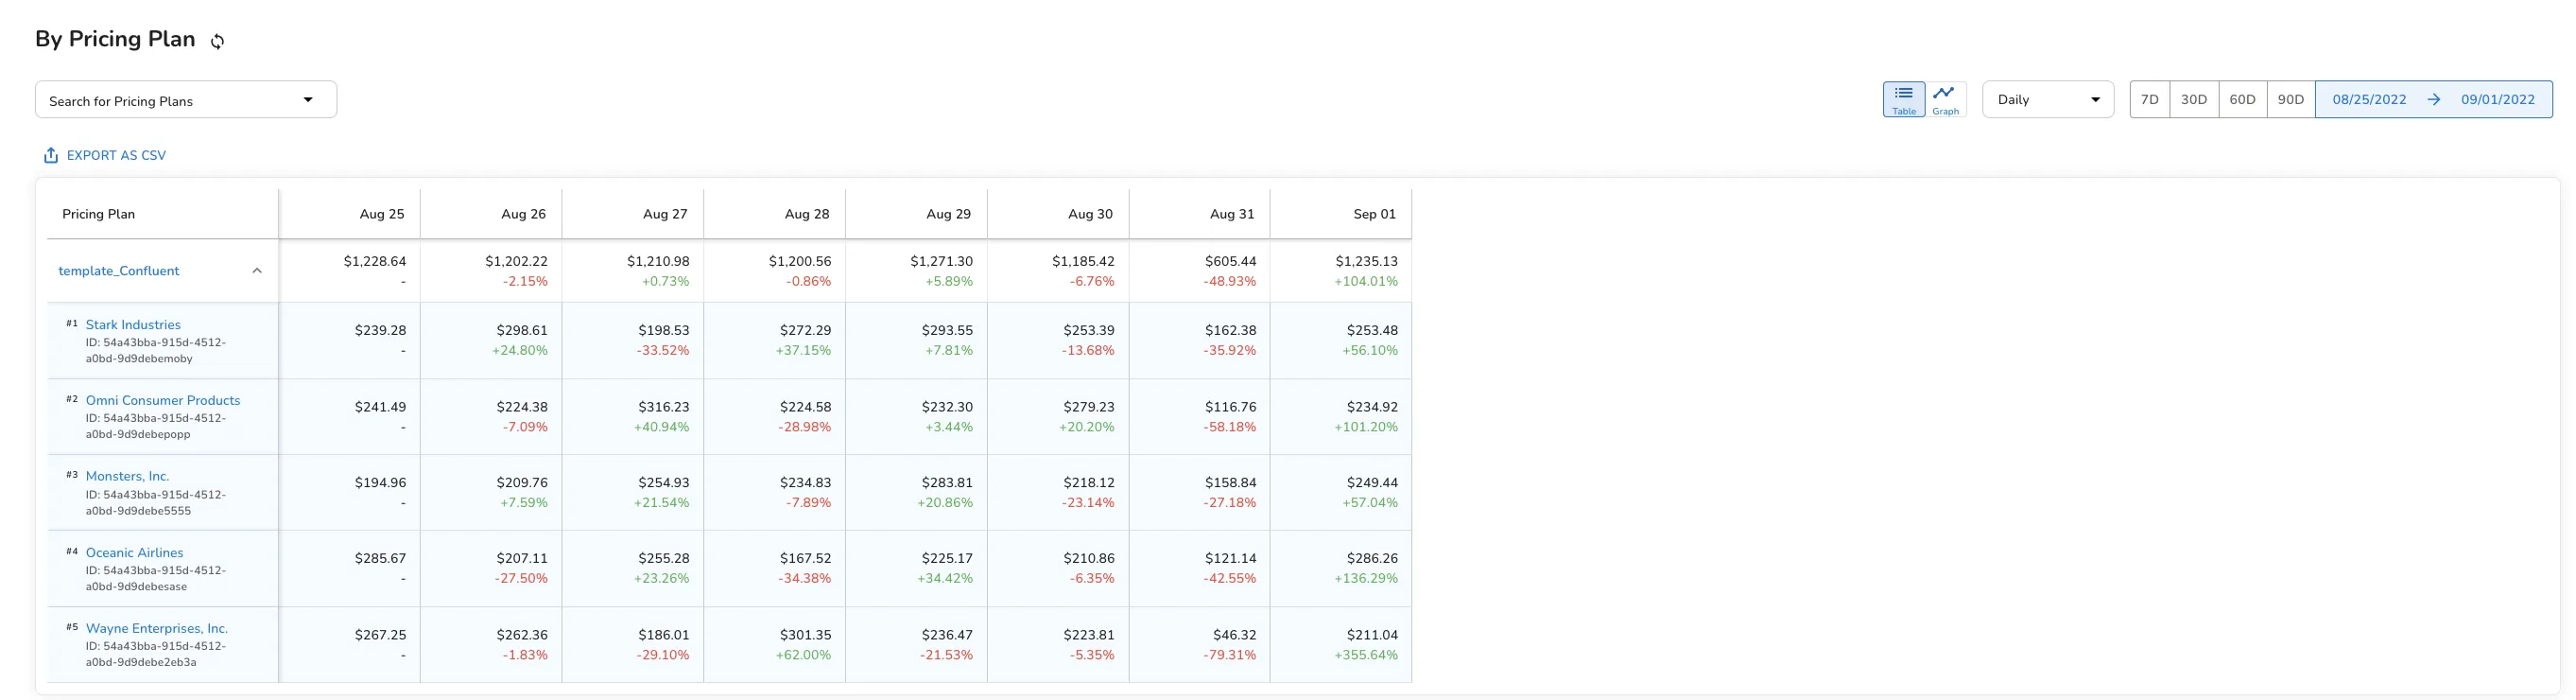
The Pricing Plan View displays revenue segmented by individual pricing plans. If you offer multiple plans, such as Starter, Pro, or Enterprise, this view makes it easy to compare their performance across selected time ranges and intervals. It helps you understand which plans generate the most revenue and how each one is performing over time.

Selecting a pricing plan from the list will show the top five revenue-generating customers for that pricing plan.
Billing by Meter
The Meter View displays revenue segmented by each individual meter. If you have multiple pricing plans that use different meters, all of them will be included in this view.
For each meter, the table shows daily revenue totals along with the percentage change from the previous day. You can customize the time range and interval to match your reporting needs.
Selecting a meter reveals the top five customers based on their spend for that specific meter. This breakdown follows the same format used in the Pricing Plan view.